Introduction
In southern Norway, recently occurring top dieback in 40-50 years old forest stands of Norway spruce (Piceaabies(L.) Karst.) is thought to be associated with climatic extremes (Hentschel et al. 2014). In this region, the period between 2004 and 2006 was characterized by high water deficits during the growing season, estimated as the difference between the cumulative precipitation and the potential evapotranspiration (see Fig 1 in Hentschel et al. 2014). During this period, trees with symptoms of top dieback (Fig. 1) showed lower intrinsic water-use efficiency that is associated with increased stomatal conductance (Hentschel et al. 2014) and produced wood with lower density, indicating higher vulnerability to cavitation (Rosner et al. 2014).Functional traits for estimating hydraulic vulnerability gain increasing importance as screening tools because hydraulic experiments are labour intensive or prone to errors (Cochard et al. 2013). In this study,weextend an existing dataset (Rosner et al. 2014) with tree samples and derivefunctional traitsfor hydraulic vulnerability from tracheid dimensions assessed by SilviScan technology(Evans 1994). Thereafter wedocument how these proxieschanged over the years in20 healthy looking and in 20 declining trees in order to learn more about the predisposing factors for top dieback in Norway spruce in southern Norway.
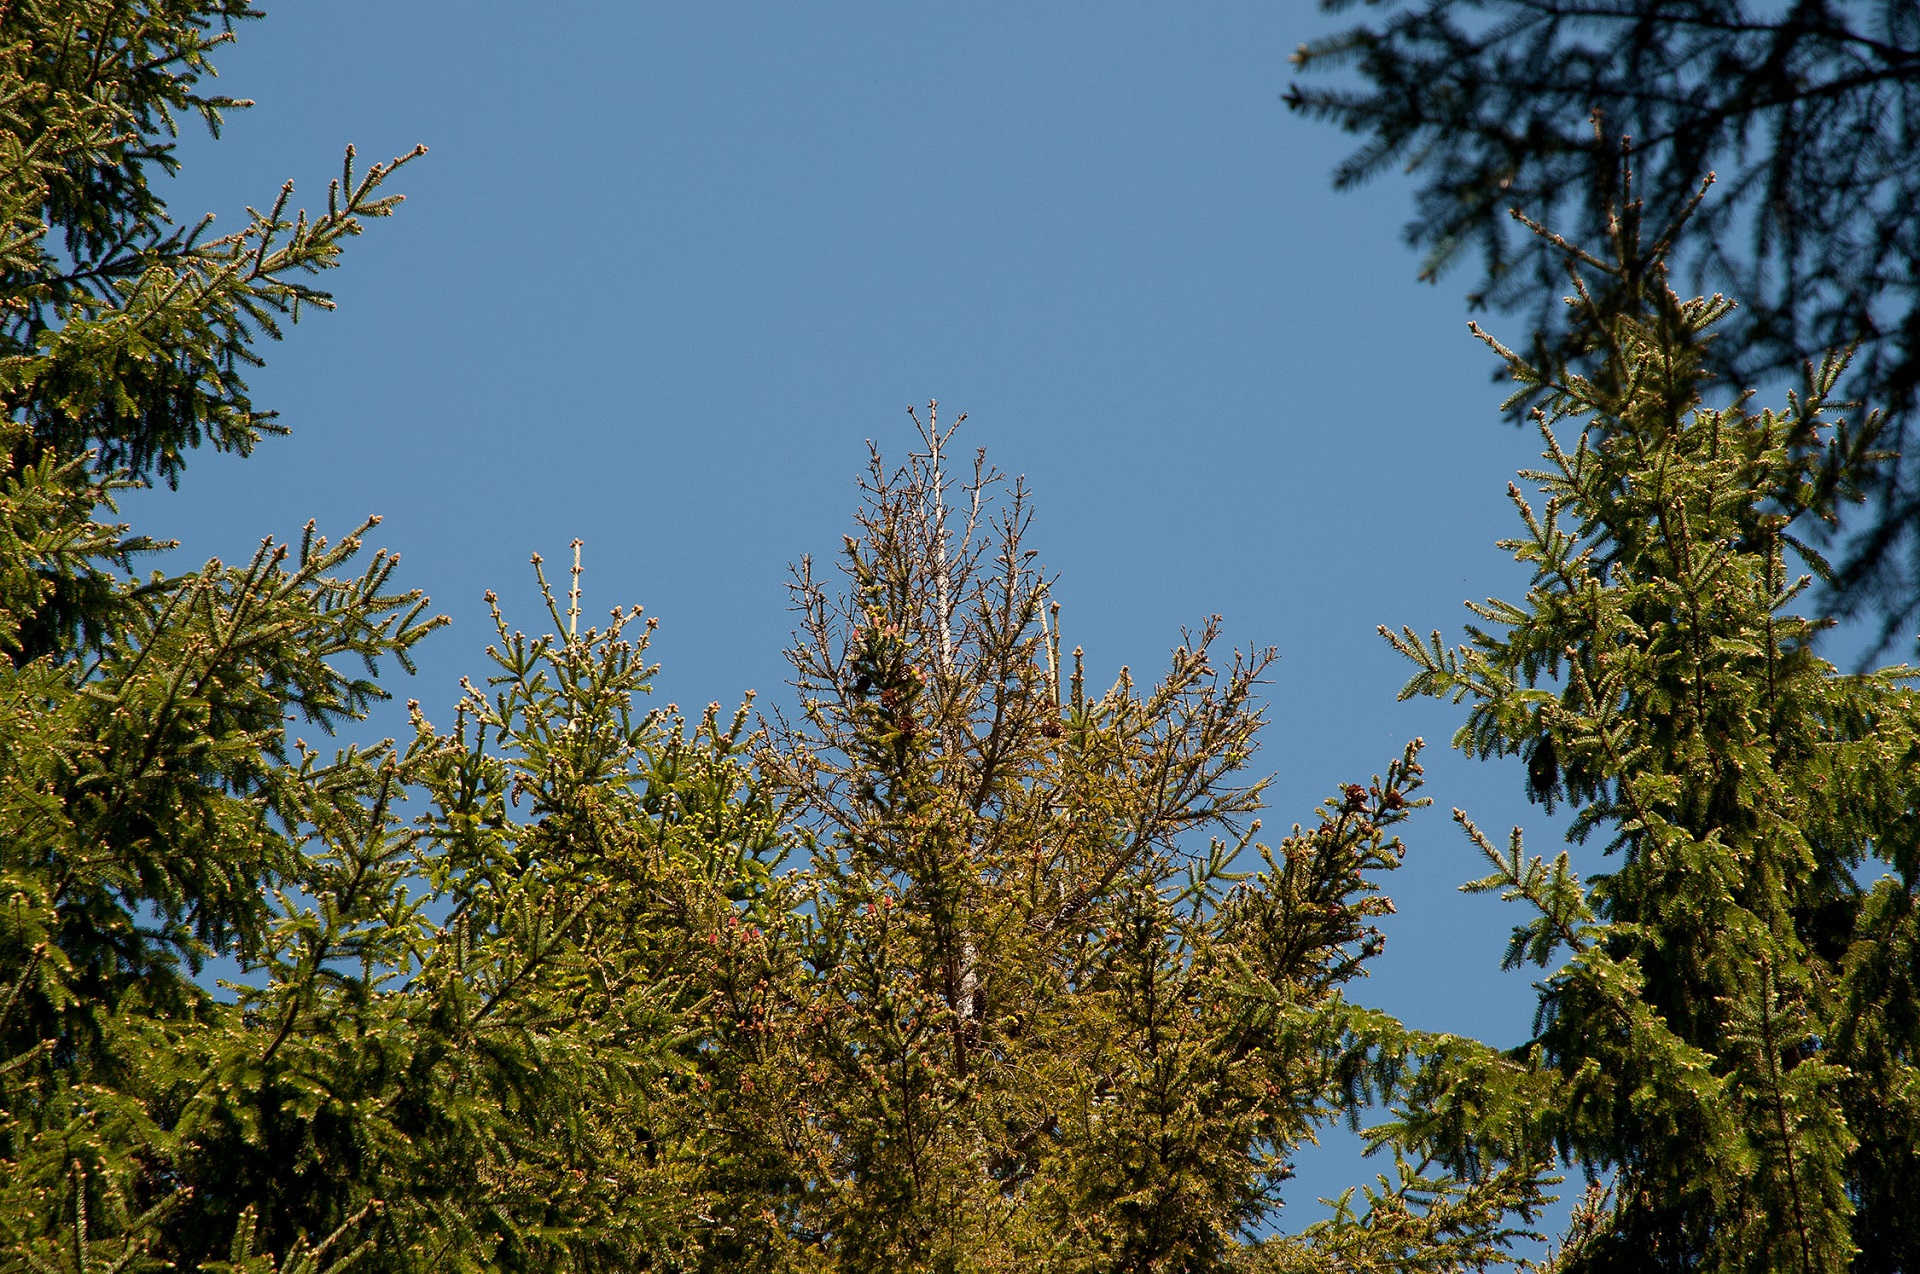
Figure 1: Norway spruce tree with symptoms of top dieback (middle) among healthy looking trees. Photo: Isabella Børja
Materials and Methods
Ten healthy looking trees and ten trees with visual signs of top dieback such as dry tops and needle yellowing in the top (Fig. 1) were selected in Sande (Lat. (N) 59°35’, Long. (E) 10°12’)and Hoxmark (Lat. (N) 59°40’, Long. (E) 10°45’), respectively (n = 40 trees). For a previous study (Rosner et al. 2014), 24 trees (6 symptomatic and 6 non-symptomatic trees per site) were harvested in order to assess vulnerability to cavitation (P50) of the trunk wood by means of the pressure collar technique (Domec and Gartner 2002). Wood cores taken at breast height and small wood beams, where P50data were available (Rosner et al. 2014), were analyzed with SilviScan technology. Wood density, radial- and tangential tracheid diameters and wall thickness were thus available in 25 µm radial measurement steps. For each single annual ring, a conduit wall reinforcement, i.e. wall (t) to lumen (b) ratio, was calculated as (t/b)² (Hacke et al. 2001). The conduit wall reinforcementwas not derived from the whole ring dataset but from wood with a density < 700 kg/m³ that comprises early wood and transition wood but not latewood (Dalla-Salda et al. 2014).
Results
P50 was strongly related to conduit wall reinforcement (r2 = 0.71, P < 0.001, n = 19); (t/b)² could be thus used as good proxy for vulnerability to cavitation (Fig. 2).
After 2005, height and radial incrementsshowed different trends in trees with symptoms of top dieback compared to healthy looking trees (Figs. 3a-b). Before 2004, symptomatic trees investigated in our study produced slightly higher radial increments than healthy looking trees. The differences were however not significant.After 1999, (t/b)²was lower in almost all annual rings of symptomatic trees (Fig. 3c); thus before, during and after a period with water deficit (2004 – 2006). In 2000, the difference was statistically significant. Steadily increasing (t/b)² after 2006, resulting in a higher (t/b)² of symptomatic trees in 2010, can be interpreted as a reaction to stress.
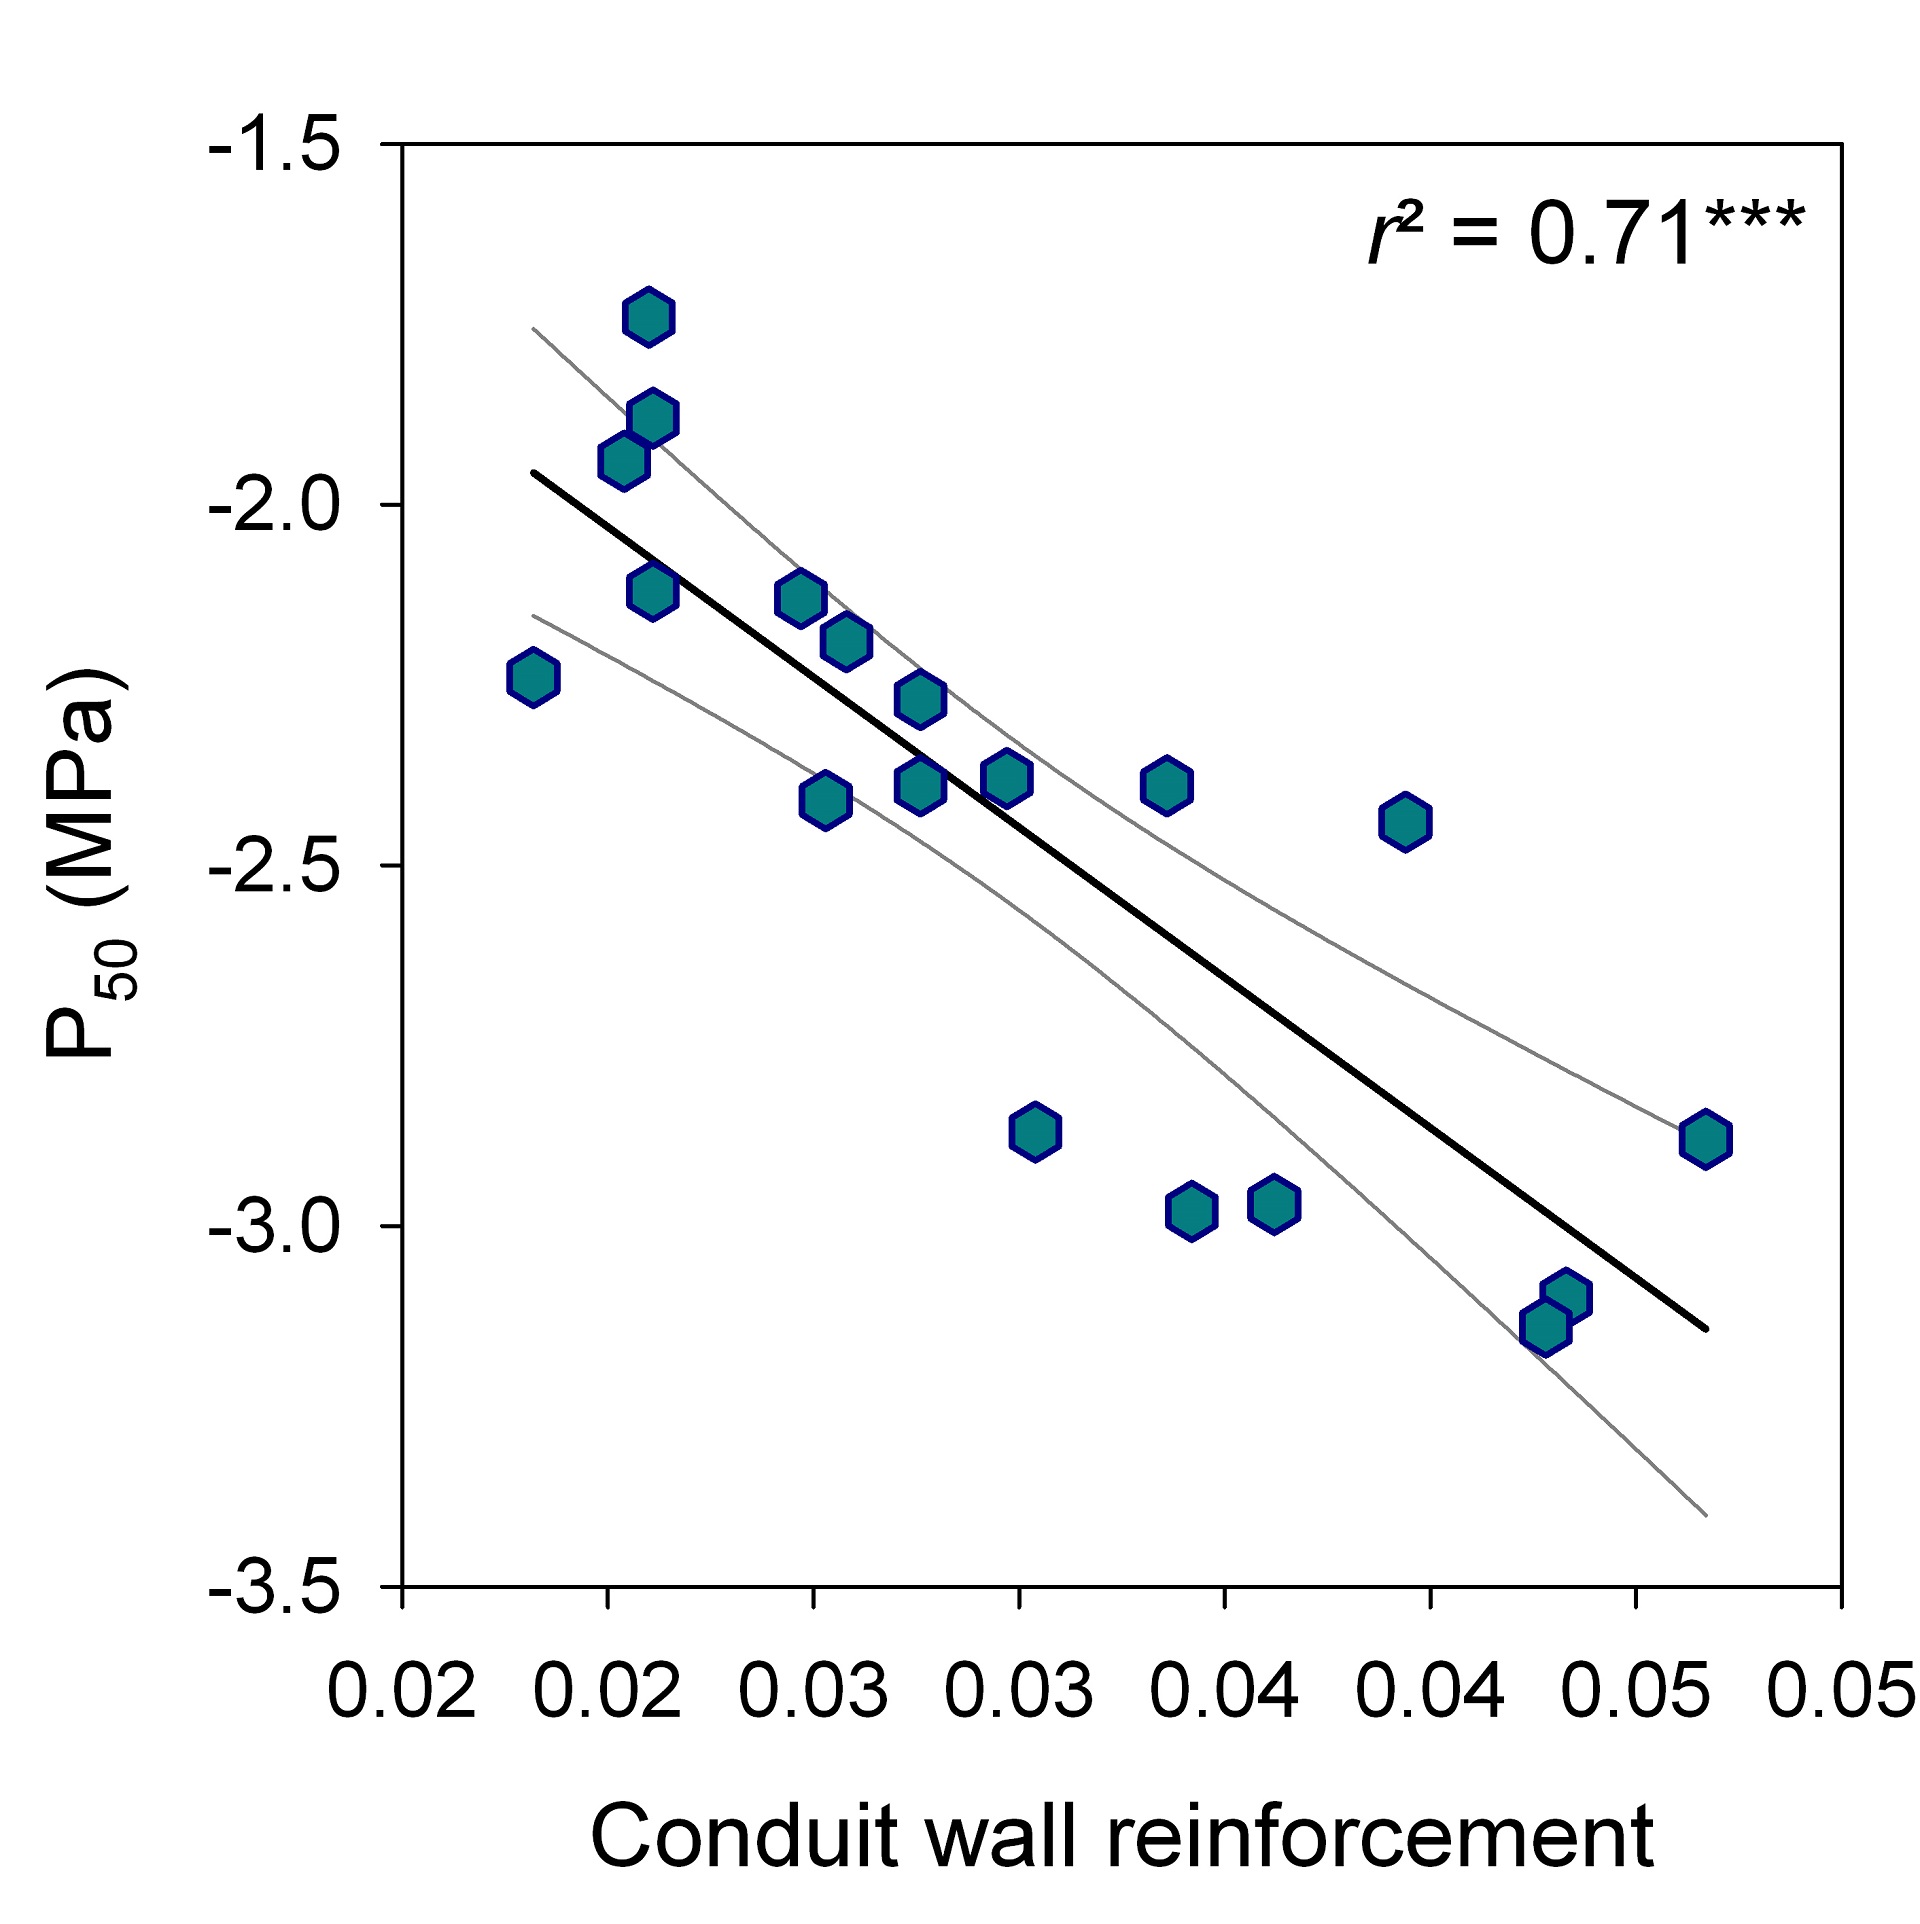
Figure 2: Linear relationship (regression line and 95% confidence interval) between conduit wall reinforcement (t/b)² and vulnerability to cavitation (P50).
Discussion
Producing wood with lower (t/b)² during periods of sufficient water supply can be a risky investment regarding hydraulic safety for Norway spruce trees. This“strategy” can lead to lower survival prospects under the impact of an extreme sudden drought because this species uses at least ten annual rings for axial water transport (Bertaud and Holmbom 2004). Due to irreversible embolism induced by drought stress (Choat et al. 2015), the hydraulic conductivity might get lost in more vulnerable annual rings. This can lead to an impairment of the water supply of the crown andthus to reduced growth. In addition, trees with top dieback tended to spend water; they had a predisposition to less strict stomatal control. Trees with both characteristics can most likely not cope with several drought periods during subsequent years (Hentschel et al. 2014).
Proxies for P50 can be useful tools to screen for provenances or individuals with higher hydraulic safety (Dalla-Salda et al. 2009). Published relationships between t/b ratio and P50 are much strongerwithin a given species (e.g. Domec et al. 2009) than across conifer species (e.g. Bouche et al. 2014). Strong relationship between t/b ratio (thus (t/b)²) and P50within a tree of a given species exist due to the extremechangesof P50and thus t/b or tracheid lumen diameters (Anfodillo et al. 2013) along a conifer trunk and the variability in P50between different plant organs (Domec et al. 2009). This implies smart sampling strategies: in order to perform reliable comparisons between individuals of the same species, sapwood for hydraulic testing or for determination of functional proxies shall be collected from a given plant organ and from annual rings of comparable age (i.e. juvenile versus mature) at the same (relative) tree height.
Wood quality traits such as density (and most likely (t/b)²) are highly heritable in Norway spruce. Recently, Chen et al. (2014) found thatearly selection for wood density is highly effective from rings 6–7. Starting at that age, selecting individuals for higher hydraulic safety in trunk wood could be possible. However, trunkwood safety covers only one aspect of drought sensitivity related to hydraulic architecture (see Hacke et al. 2015) and selected trees must be tested for their hydraulic performance in field experiments. In species such as Norway spruce, wood density is genetically negatively correlated with growth (Rosner et al. 2014). Thus, when selecting Norway spruce trees for higher hydraulic safety and/or more strict stomatal control, reduction in growth ratemight have to be taken into account.
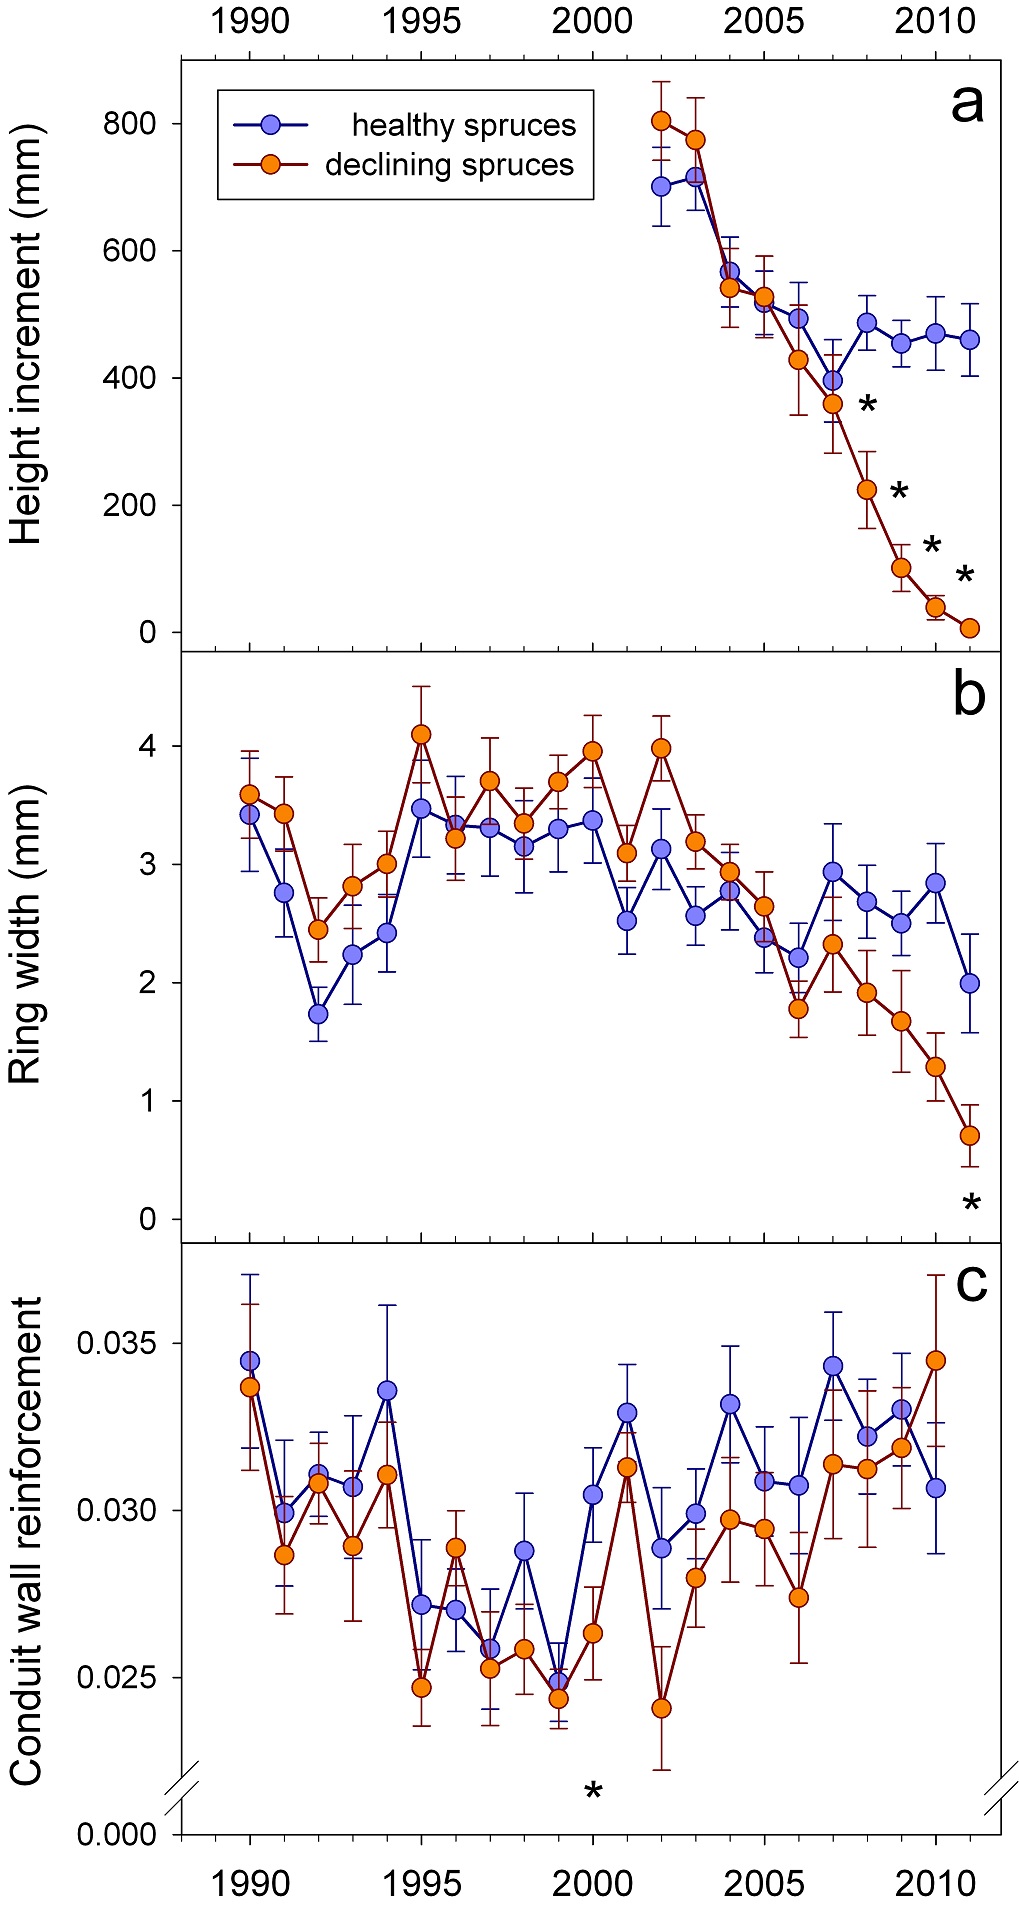
Figure 3: Time course of height increment (a), radial increment (b) and wall/lumen ratios of earlywood (c). Significant differences are indicated by “*”.
Acknowledgements : this study was financed by the Norwegian Research Council, by Skogtiltaksfondet, six regional funds in Norway (Fylkesmannen), by the Austrian Science Fund FWF (V146-B16) and by the CZ Ministry of Education (No. 6215648902). This work has been carried out under the framework of the COST FP1106 network STReESS.